Built Environment
We are workign on the time taken for the project approval and the cost of the project. It will also detemine the data about how many projects are approved in a month.
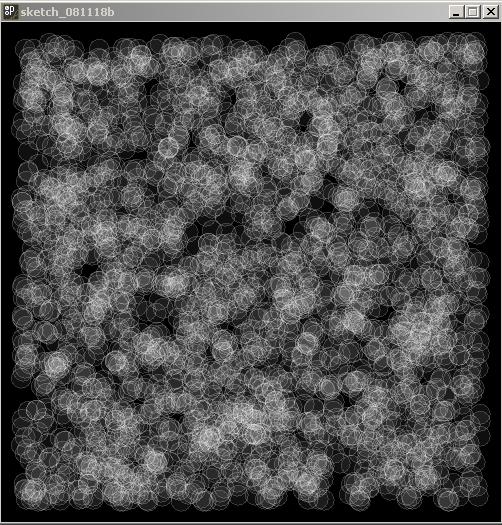
these are some of the random circles on a screen.
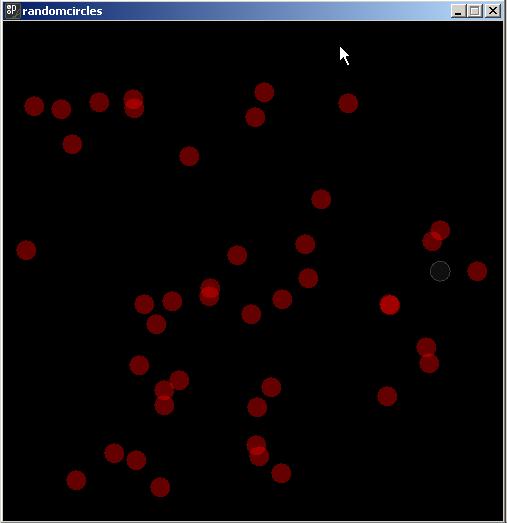
red circles represnets the months for last 4 years. these circles will pop up as the time progresses
after overlaping both the digrams each circle will be connected to the other circle.eg. if the project lodged date is june2005 and project approved date is dec 2005 then the line will be created in between.
About this entry
You’re currently reading “Built Environment,” an entry on The street as platform
- Published:
- November 18, 2008 / 12:15 pm
- Category:
- progress
- Tags:


No comments yet
Jump to comment form | comment rss [?] | trackback uri [?]